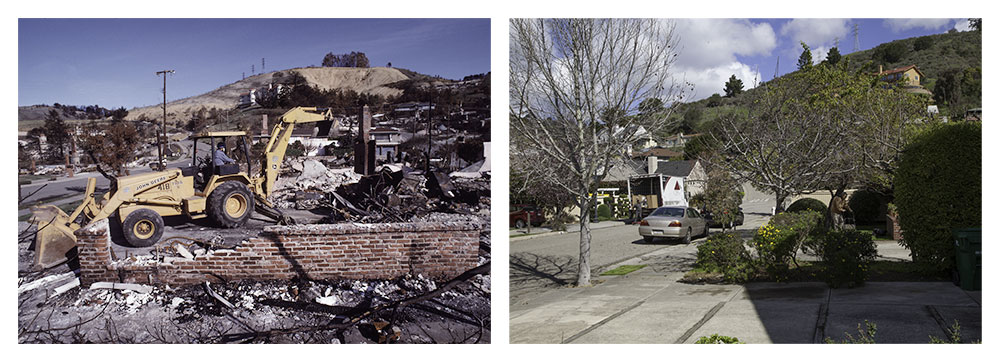
This 2019 rephotography takes a second look at the hill neighborhoods destroyed by the Oakland Firestorm of 1991. View the series here.
.
This 2019 rephotography takes a second look at the hill neighborhoods destroyed by the Oakland Firestorm of 1991. View the series here.
.
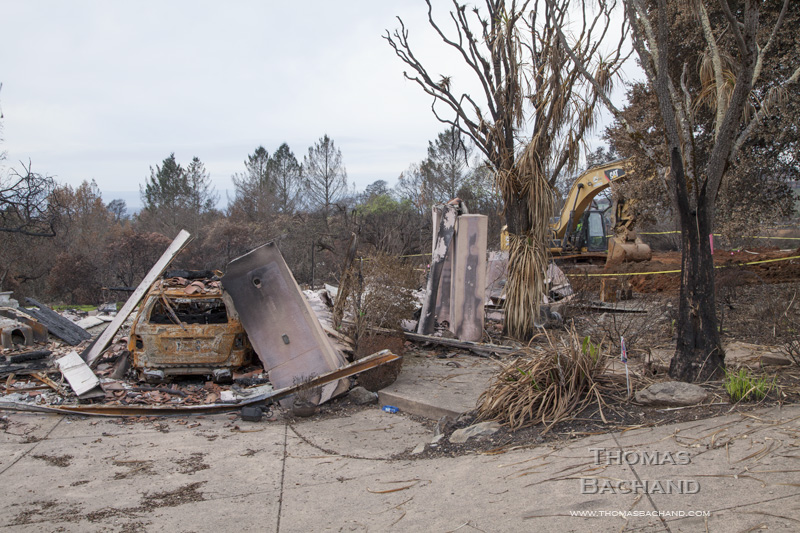
This series looks at the post-fire landscape of Santa Rosa’s 2017 Tubbs Fire. Having lived through the 1991 Oakland Firestorm, I found distant memories resurfacing.
 Instinctively we are drawn to the grandeur of nature. Of the California redwoods, John Steinbeck wrote, “The redwoods, once seen, leave a mark or create a vision that stays with you always. No one has ever successfully painted or photographed a redwood tree. The feeling they produce is not transferable. From them comes silence and awe. It’s not only their unbelievable stature, nor the color which seems to shift and vary under your eyes, no, they are not like any trees we know, they are ambassadors from another time.”
Before California became a state, schooners entering San Francisco Bay navigated by the old growth redwoods on the Oakland hills – nearly 20 miles distant. Today those old growth forests are gone, carted away along with their root systems for the early economic growth of the West Coast. The remaining transitioning forests are dense and woody and inhabited by tall, thin trees. Less than five percent of California’s ancient old growth redwood forests remain.
Driving north from my home in Oakland, through the backroads in search of the ancient temperate rainforests, I came to realize that we had not only extracted the trees, but the wilderness, as well. This was now a landscape of our own construct. The parks, largely on bottomlands where the largest trees grow, were surrounded by vast areas being logged. These sanctuaries were bisected by picnic sites, parking lots, campgrounds, and highways – the trees on exhibit behind auto glass.
It was only on the trails that I discovered the forests of the Yurok, Tolowa, Karok, Chilula, and Wiyot. Away from the pavement, the trees wide and tall were spaced apart in majestic stands, their tops obscured by distance. The understory of huckleberry, rhododendron, and waist-high ferns, glowed in the filtered light.
As a photographer, I am enticed back down the trail to the “construct.” There I find evidence of our beliefs, priorities, and our culture’s perception of our place in nature.
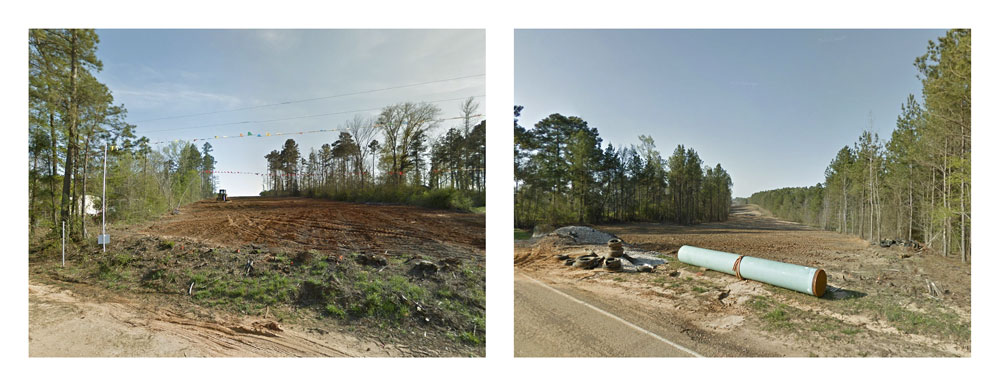
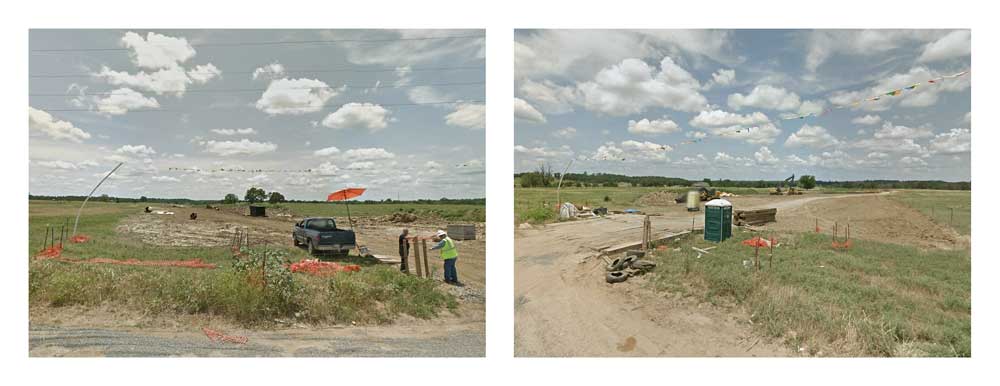
Crossings. Winona, Texas.
In Crossings, the controversial delivery of tar sands oil to Port Arthur, Texas is examined at ground level through the dispassionate eye of Google Street View, the automated documentarian of our nation’s roadways. The 180° diptychs compiled here are composed of opposing camera views from each intersection between the Keystone XL pipeline corridor and the roving camera. This is a historical moment, captured incidentally, accessible for a year or so, and then deleted from the record at the next passing of the camera.
Underlying this work are the Keystone Mapping Project’s custom maps — the only publicly available interactive maps of the proposed Keystone XL pipeline. With over 150,000 visitors, the KMP website has been and invaluable resource to communities, landowners, journalists, researchers, nonprofits, and other stakeholders.
For more on this series, visit Crossings and the Keystone Mapping Project.
For information on this image, including archival print purchase, contact me with the title of this post.
Registered © Thomas Bachand. All Rights Reserved.
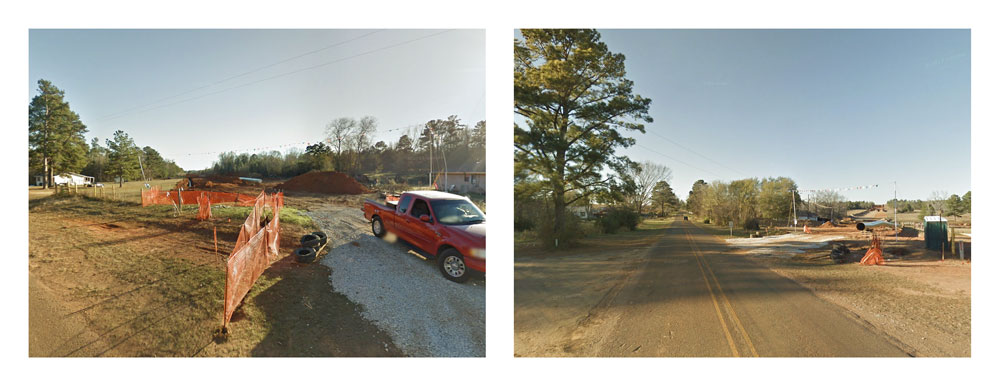
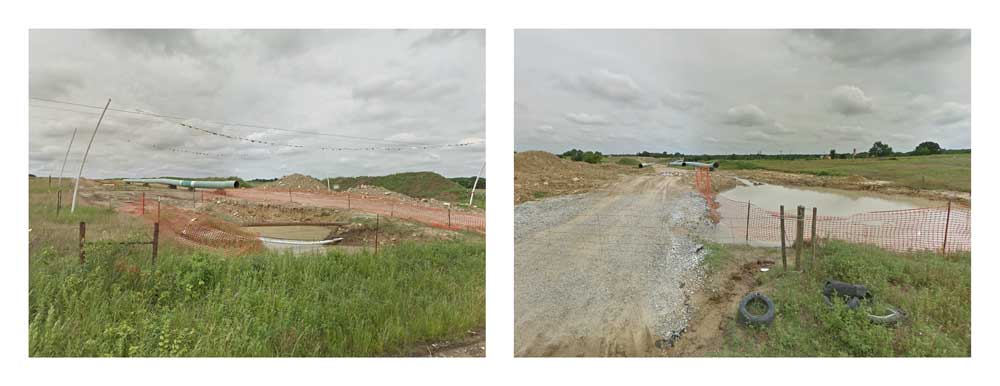
Crossings. Wewoka, Oklahoma.
In Crossings, the controversial delivery of tar sands oil to Port Arthur, Texas is examined at ground level through the dispassionate eye of Google Street View, the automated documentarian of our nation’s roadways. The 180° diptychs compiled here are composed of opposing camera views from each intersection between the Keystone XL pipeline corridor and the roving camera. This is a historical moment, captured incidentally, accessible for a year or so, and then deleted from the record at the next passing of the camera.
Underlying this work are the Keystone Mapping Project’s custom maps — the only publicly available interactive maps of the proposed Keystone XL pipeline. With over 150,000 visitors, the KMP website has been and invaluable resource to communities, landowners, journalists, researchers, nonprofits, and other stakeholders.
For more on this series, visit Crossings and the Keystone Mapping Project.
For information on this image, including archival print purchase, contact me with the title of this post.
Registered © Thomas Bachand. All Rights Reserved.
Crossings. Centrahoma, Oklahoma.
In Crossings, the controversial delivery of tar sands oil to Port Arthur, Texas is examined at ground level through the dispassionate eye of Google Street View, the automated documentarian of our nation’s roadways. The 180° diptychs compiled here are composed of opposing camera views from each intersection between the Keystone XL pipeline corridor and the roving camera. This is a historical moment, captured incidentally, accessible for a year or so, and then deleted from the record at the next passing of the camera.
Underlying this work are the Keystone Mapping Project’s custom maps — the only publicly available interactive maps of the proposed Keystone XL pipeline. With over 150,000 visitors, the KMP website has been and invaluable resource to communities, landowners, journalists, researchers, nonprofits, and other stakeholders.
For more on this series, visit Crossings and the Keystone Mapping Project.
For information on this image, including archival print purchase, contact me with the title of this post.
Registered © Thomas Bachand. All Rights Reserved.
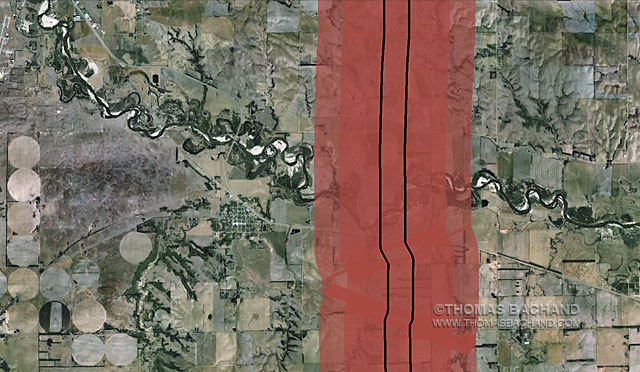
Voluntary Evacuation Zone. Orchard, Nebraska.
Forming the basis of my Voluntary Evacuation Zone (VEZ) grid abstract series are aerial imagery and custom mapping features drawn from my Keystone Mapping Project (KMP) and its Keystone XL Google Earth view. The Keystone XL VEZ is based on the health department response to a diluted bitumen spill in Michigan’s Kalamazoo River. This photographic series is an exploration of both our perception of, and impact upon, the landscape. Each panel examines the interplay of physical and human geography, revealing broader patterns and larger questions.
Underlying this work are the KMP’s custom maps — the only publicly available interactive maps of the proposed Keystone XL pipeline. With over 150,000 visitors, the KMP website has been and invaluable resource to communities, landowners, journalists, researchers, nonprofits, and other stakeholders.
In November of 2015, President Obama denied the cross-Canadian-border permit for the northern segment of the Keystone XL, effectively waylaying construction and splitting the difference with industry on the entire pipeline after fast-tracking the southern leg from Cushing Oklahoma to Texas Gulf Coast refineries in 2012. A week after December’s UN COP climate conference in Paris, the President signed a budget bill which contained measures lifting the 40-year-old US oil export ban and limiting environmental review of new petroleum pipelines to six months (for more visit the KMP blog). TransCanada has vowed to revive the Keystone XL at a later date. It should be noted that the Keystone XL environmental review process has taken over five years and the Department of State (DoS) has yet to release the supporting mapping data required to evaluate the DoS’ own environmental impact reports. The Keystone Mapping Project’s route data is drawn from alternative sources.
For more on this series, visit the Voluntary Evacuation Zone Series and the Keystone Mapping Project website.
For information on this image, including archival print purchase, contact me with the title of this post.
Registered © Thomas Bachand. All Rights Reserved.
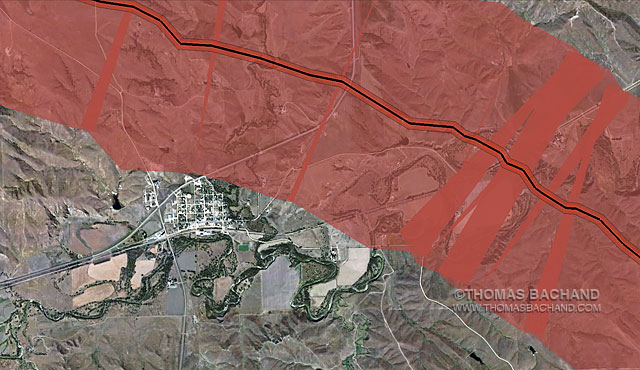
Voluntary Evacuation Zone. Midland, South Dakota.
Forming the basis of my Voluntary Evacuation Zone (VEZ) grid abstract series are aerial imagery and custom mapping features drawn from my Keystone Mapping Project (KMP) and its Keystone XL Google Earth view. The Keystone XL VEZ is based on the health department response to a diluted bitumen spill in Michigan’s Kalamazoo River. This photographic series is an exploration of both our perception of, and impact upon, the landscape. Each panel examines the interplay of physical and human geography, revealing broader patterns and larger questions.
Underlying this work are the KMP’s custom maps — the only publicly available interactive maps of the proposed Keystone XL pipeline. With over 150,000 visitors, the KMP website has been and invaluable resource to communities, landowners, journalists, researchers, nonprofits, and other stakeholders.
In November of 2015, President Obama denied the cross-Canadian-border permit for the northern segment of the Keystone XL, effectively waylaying construction and splitting the difference with industry on the entire pipeline after fast-tracking the southern leg from Cushing Oklahoma to Texas Gulf Coast refineries in 2012. A week after December’s UN COP climate conference in Paris, the President signed a budget bill which contained measures lifting the 40-year-old US oil export ban and limiting environmental review of new petroleum pipelines to six months (for more visit the KMP blog). TransCanada has vowed to revive the Keystone XL at a later date. It should be noted that the Keystone XL environmental review process has taken over five years and the Department of State (DoS) has yet to release the supporting mapping data required to evaluate the DoS’ own environmental impact reports. The Keystone Mapping Project’s route data is drawn from alternative sources.
For more on this series, visit the Voluntary Evacuation Zone Series and the Keystone Mapping Project website.
For information on this image, including archival print purchase, contact me with the title of this post.
Registered © Thomas Bachand. All Rights Reserved.

Campfire Circle
Part of my new series, Old Growth, this work explores California’s redwood forests and the enigma of old growth. We treasure these primal forests, yet less than five percent remain.
Registered © Thomas Bachand. All Rights Reserved.